The only 3 correct ways to use P/E
Saying that “there are only 3 correct ways to use this one indicator” sounds pretentious, we know. But so many investors really do use P/E incorrectly.
Most investors have already heard about the P/E ratio. If you haven’t, just keep in mind that it’s a popular valuation metric that can give you an idea of how expensive or cheap a stock is by comparing its price to its earnings per share (and by earnings, we mean profit, not revenue).
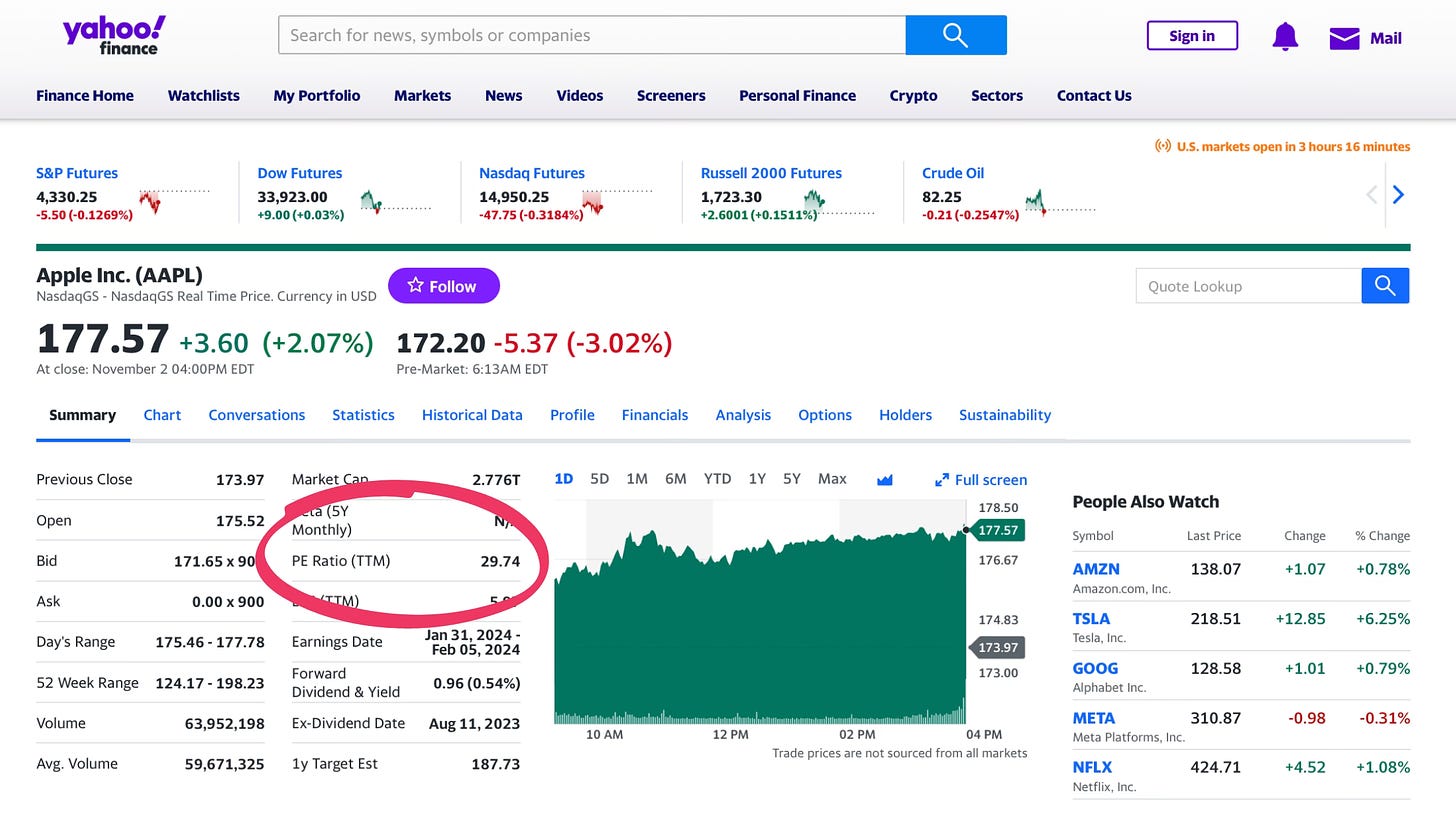
Any time you look at a stock in Yahoo Finance, it’s right there at the top:
It’s also one of the main filters in most stock screeners.
So, why is it so widely used?
well, the data you need is easy to get: just the stock price and the latest earnings per share (EPS).
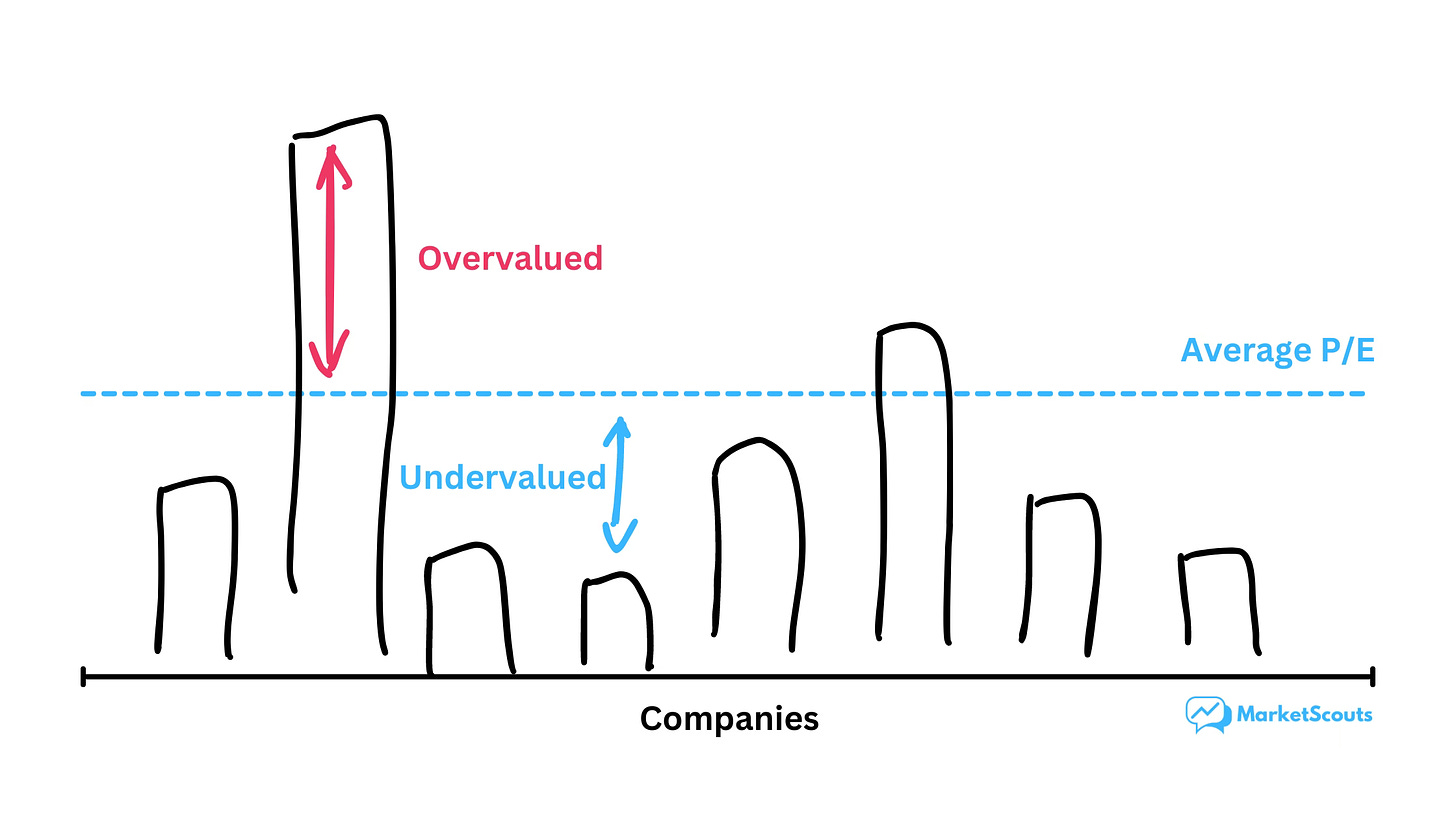
you can also easily compare this number with that of other companies, or even with that of entire indexes.
and hey, it also requires less time and technical skill than other methods.
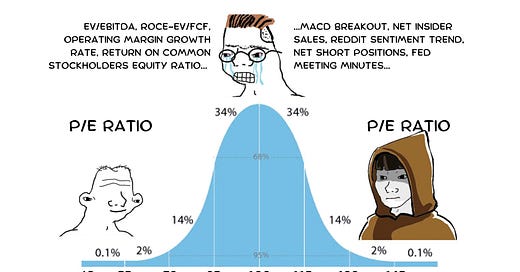
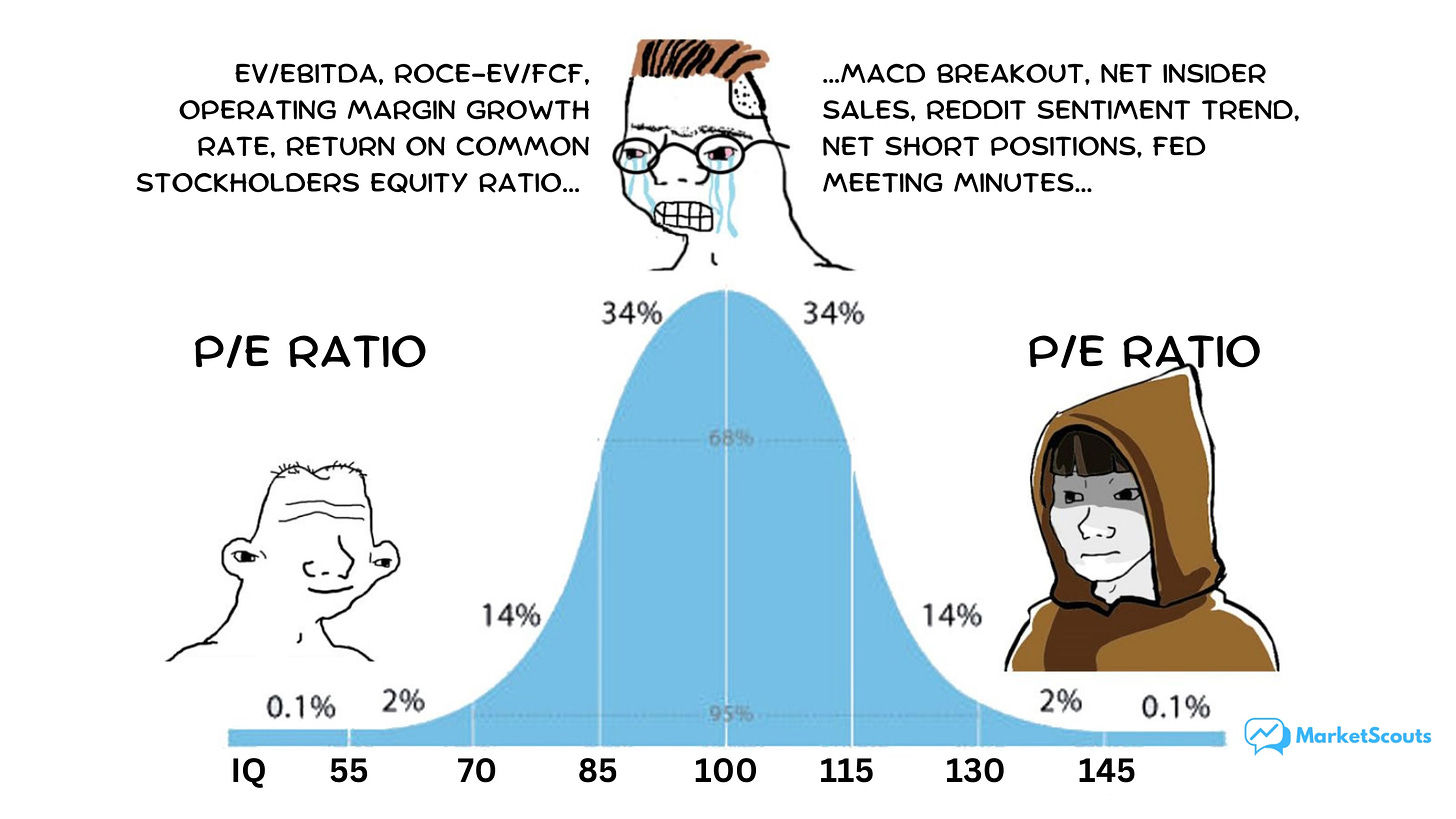
We shared the meme below in our post on the S&P 500’s P/E ratio. Pretty accurate:
Getting the P/E ratio of a company is easy. Really, you don’t even need to calculate it yourself.
And once you have it, it’s tempting to look at it and say “wow that’s low, the company must be undervalued, I can’t believe nobody has noticed”.
But that’s a mistake. Here are the only 3 correct ways to use the P/E ratio.
Right way #1: compare the valuation of similar companies at the same moment
Think of it this way: you have a few companies in the same industry. They’re all profitable. Why pay more for a dollar earned by one of them than for a dollar earned by another?
For example, let’s look at Toyota in March 2017.
How would we choose the right companies to compare it with?
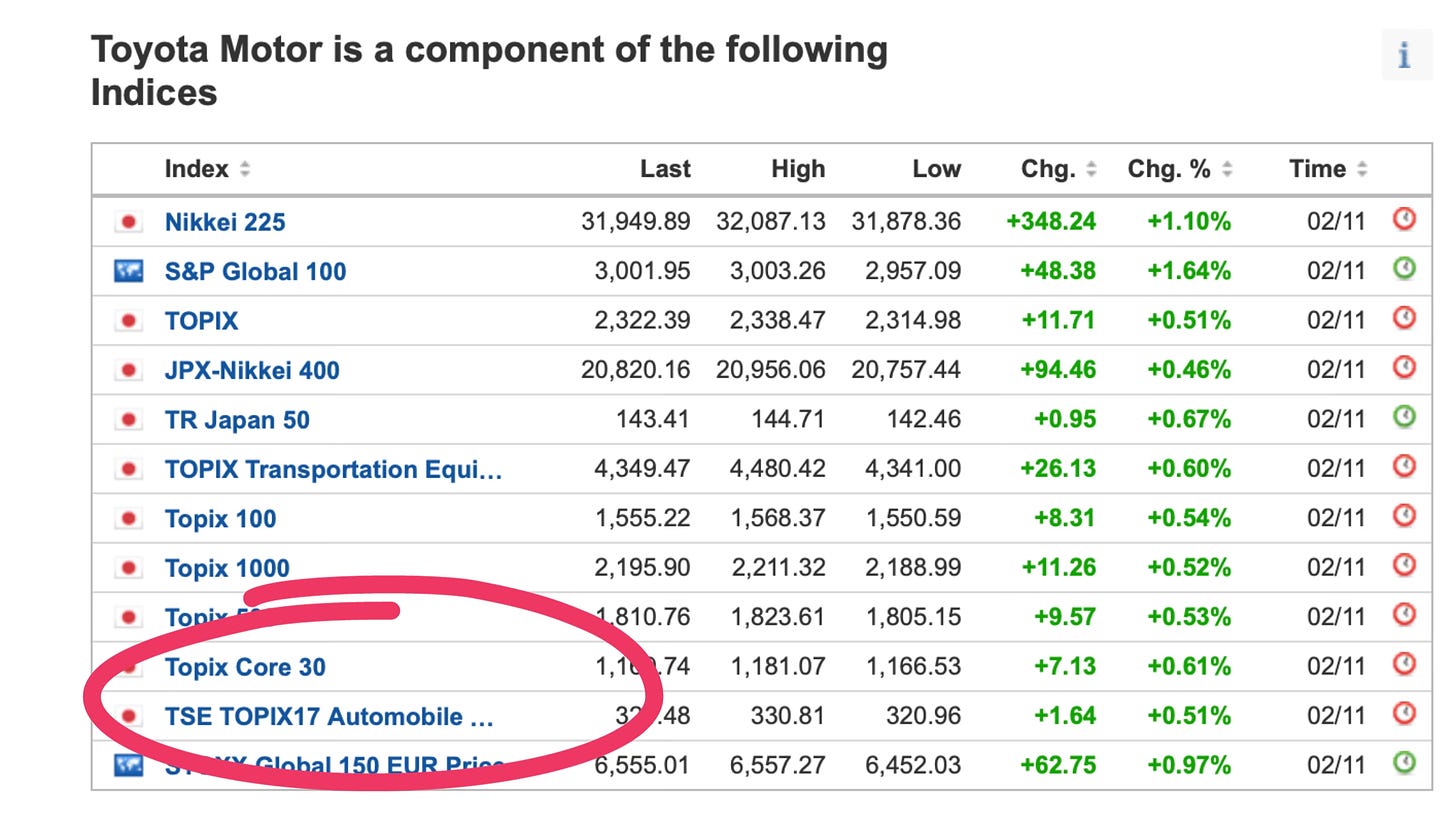
That’s actually easy to find – just ask Google “which index is Toyota in?”. You’ll likely be directed to a page like Investing.com where you’ll see which major indexes Toyota is a component of.
Now, Toyota is an auto manufacturer listed on the Tokyo exchange. Luckily, there is a Tokyo-listed index tracking the top automakers there, so let’s choose that one:
With a bit of digging, we can see that in March 2017, Toyota had a P/E ratio of 10.2, below the industry average of 10.8 (which we get from the index), hinting at the possibility that Toyota was undervalued.
Over the six years since, Toyota has grown 121%, beating the industry’s growth of 52%.
It turned out that Toyota was, in fact, undervalued and that the low P/E ratio was a decent indicator of upside.
Right way #2: compare the valuation of the same company at different points in time
Let’s say we found a company we like. How do we know it’s the right time to buy?
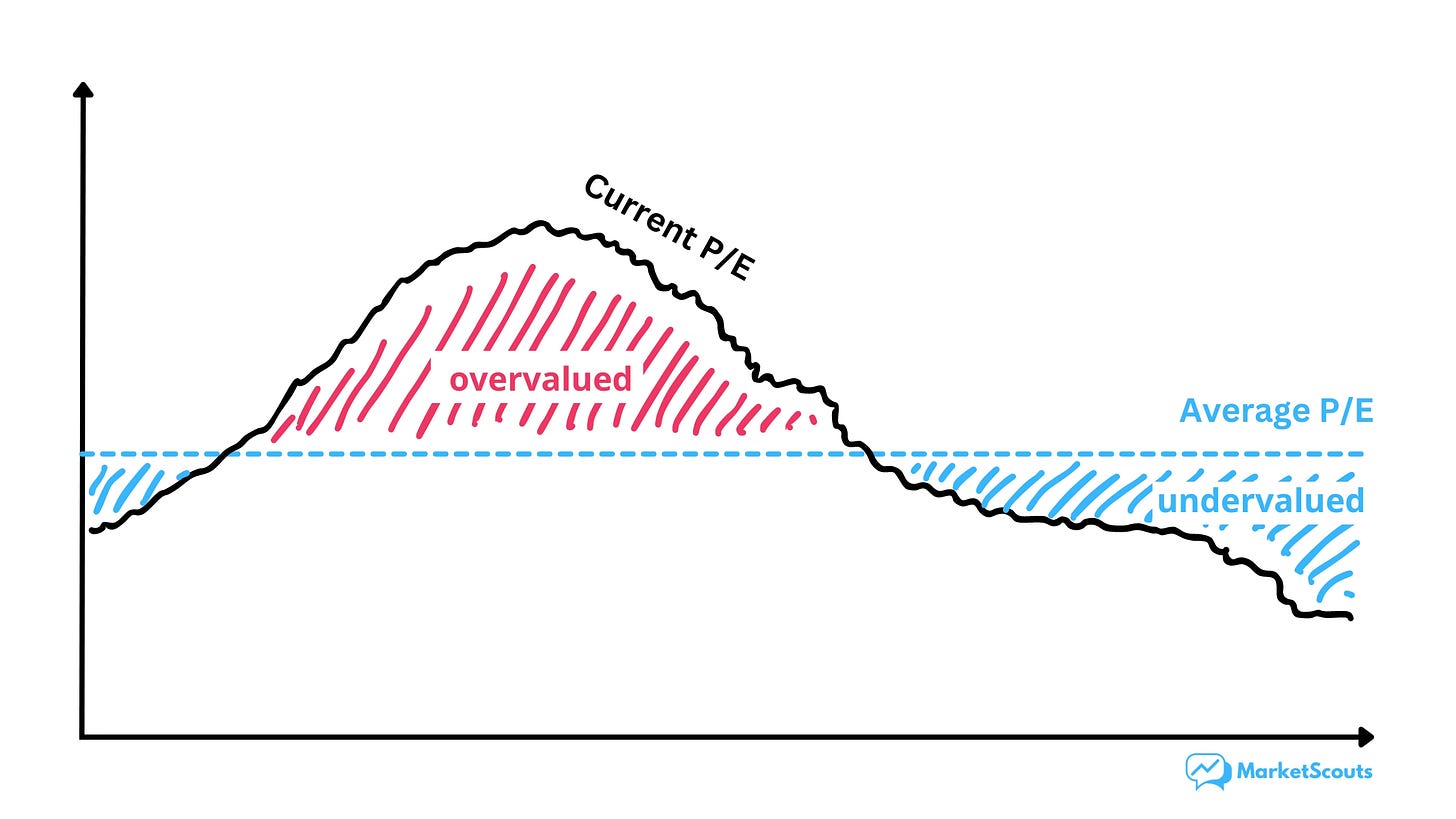
In this case, the P/E ratio can give us an idea – we can look at the P/E ratio right now and compare it with its longer-term average. Has the company ever been cheaper? What happened then? Etc.
Oh, if things would be that easy.
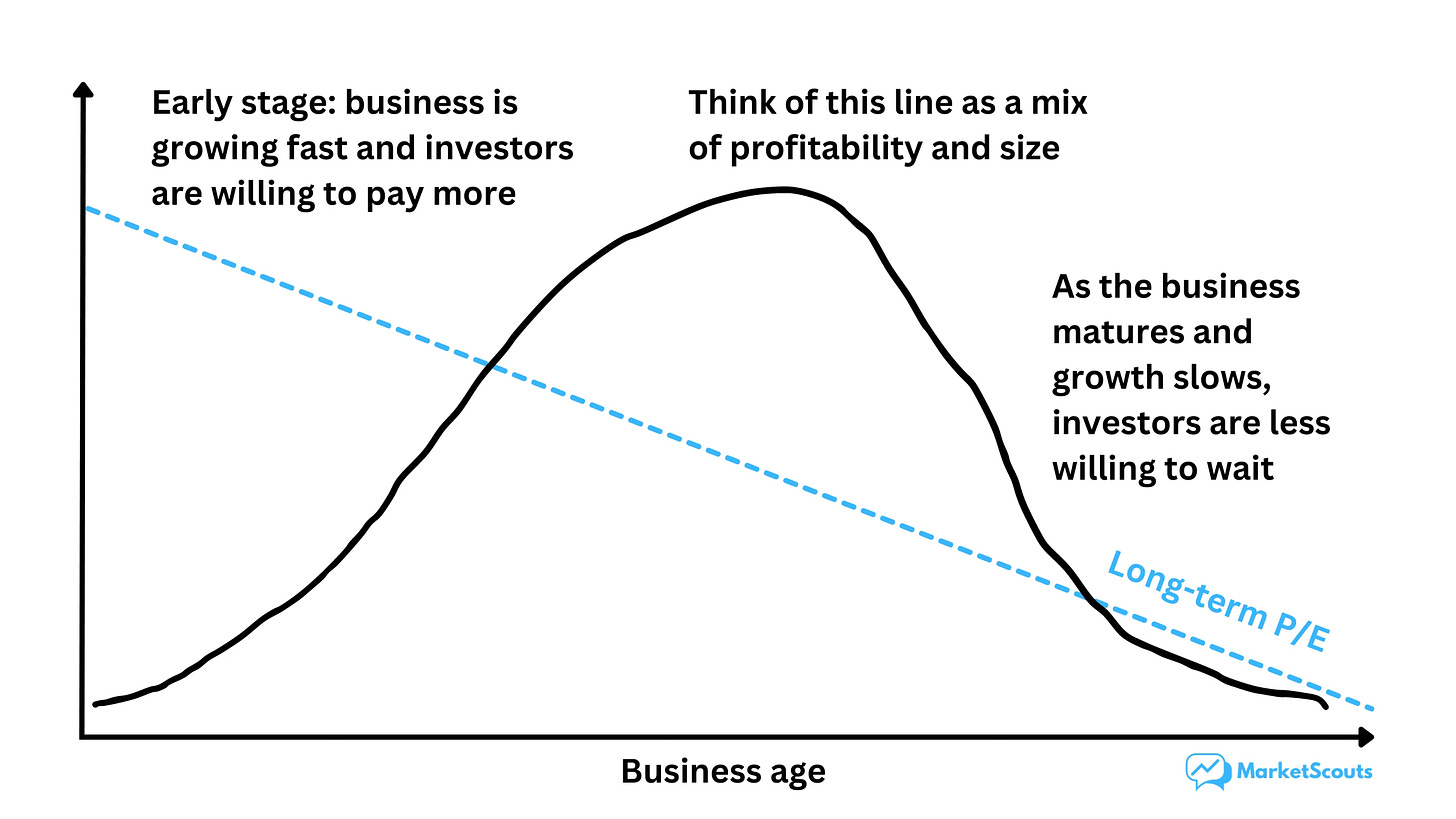
But what if the company is old? There are listed companies out there that are more than 100 years old. Should we use a P/E ratio from a hundred years ago when calculating our average?
Obviously not.
Now, there’s no clear and easy way to fix this – but it helps to think about what a business life cycle looks like.
That’s why when comparing different companies, for example, “similar” doesn’t just mean “in the same industry”.
It means “as similar as possible”, meaning in the same industry, same market, same geography, and especially the same business lifecycle stage.
Right way #3: compare the valuation of a company against the fundamentals of its business
If you think of yourself as a “value investor”, you’re going to love this. Buying wonderful businesses at a good price is what followers of Warren Buffett are all about.
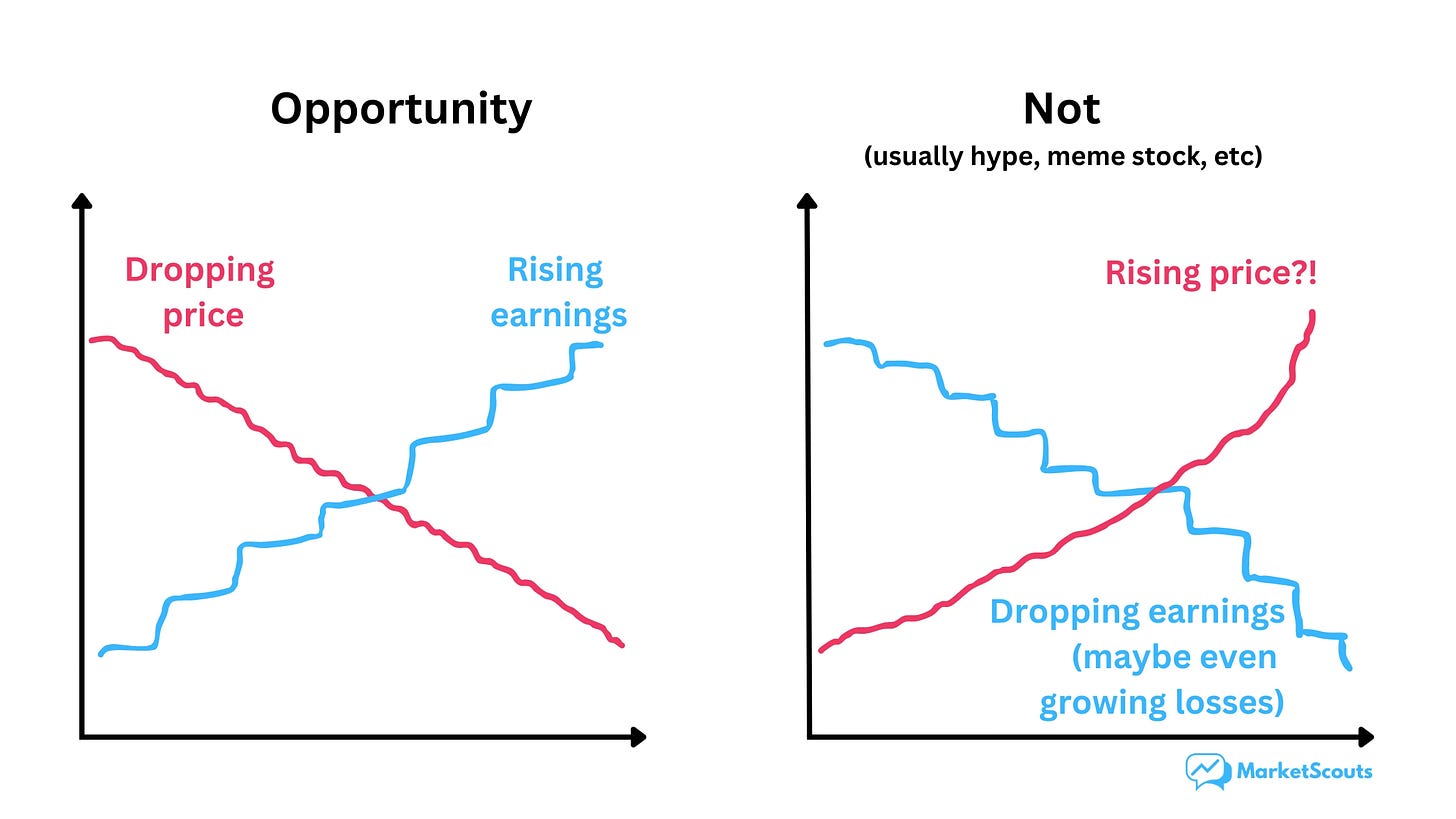
Here’s what that looks like:
For a “not” example , think of Tupperware: when the company announced that it’s on the verge on bankruptcy in the summer of this year, the meme stock crowd on Reddit sent it up 800%.
Now, there was some logic to it – the Reddit crowd was trying to squeeze hedge funds shorting the stock and force them to buy more in order to cover their short positions – but that didn’t mean that the stock was an actual “buy”.
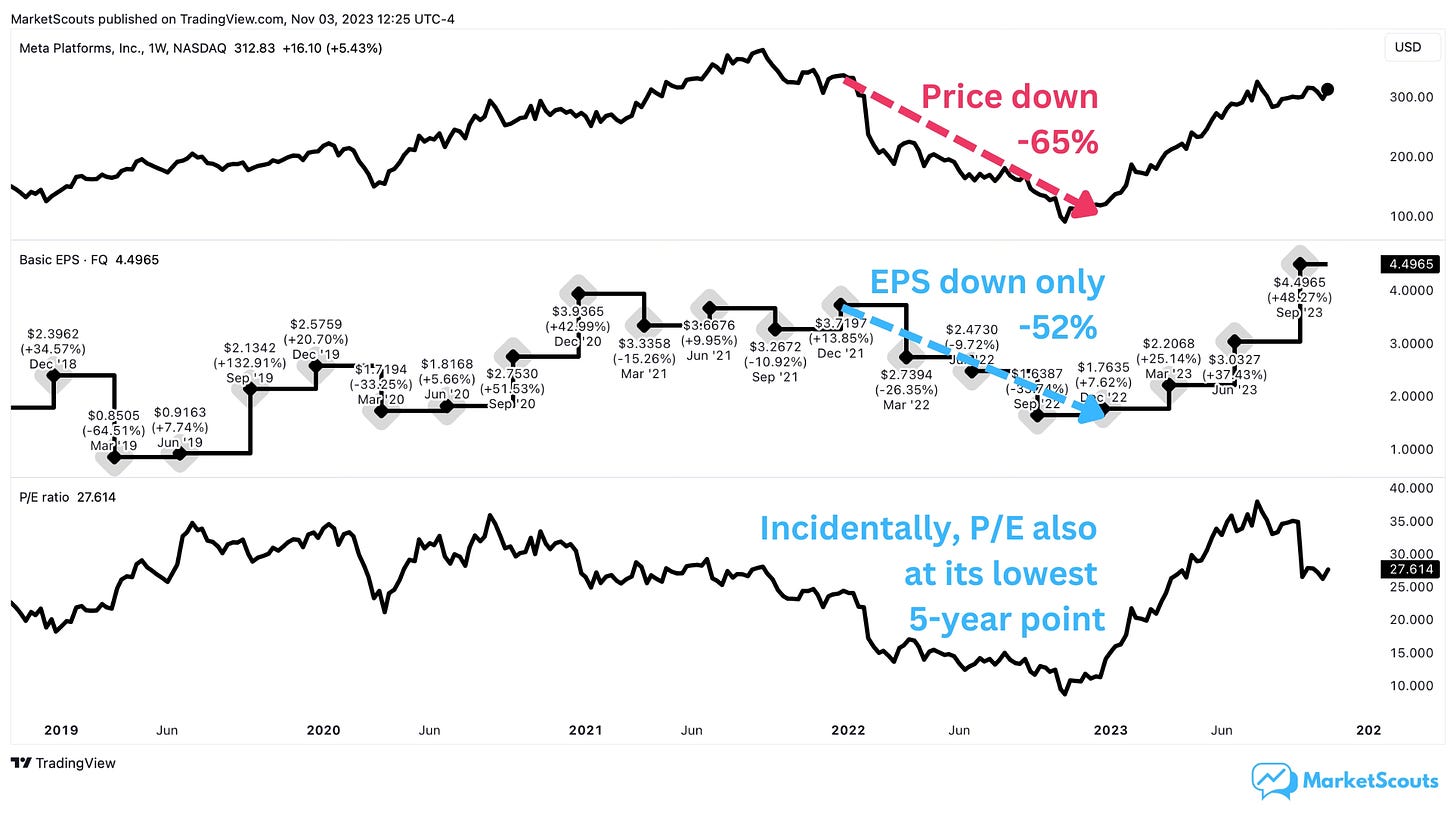
For an “opportunity” example, take Meta.
In late 2021 it reported its first ever drop in daily users. Combined with the threat from TikTok, Apple’s iOS changes, as well as the investor’s perception that Mark Zuckerberg’s bet on the metaverse was going nowhere, this led the market to dump the shares – fast.
That doesn’t mean the stock was undervalued. But its price dropped much faster than its earnings per share. And its P/E was lower than when its EPS was higher. It was an opportunity.
All it needed was a bit of clarity from the company on how it planned to tackle these issues, and the stock got back on track.
So the P/E ratio isn’t just for value investors, actually – comparing the rate of growth between earnings, forecasted earnings, and price can lead you to interesting opportunities.
Now what?
The P/E ratio is really useful – but there’s a lot the P/E ratio can’t tell you.
The P/E ratio can’t tell you if you’re comparing apples to oranges, or companies with different business models, profit margins, and at different stages in their life.
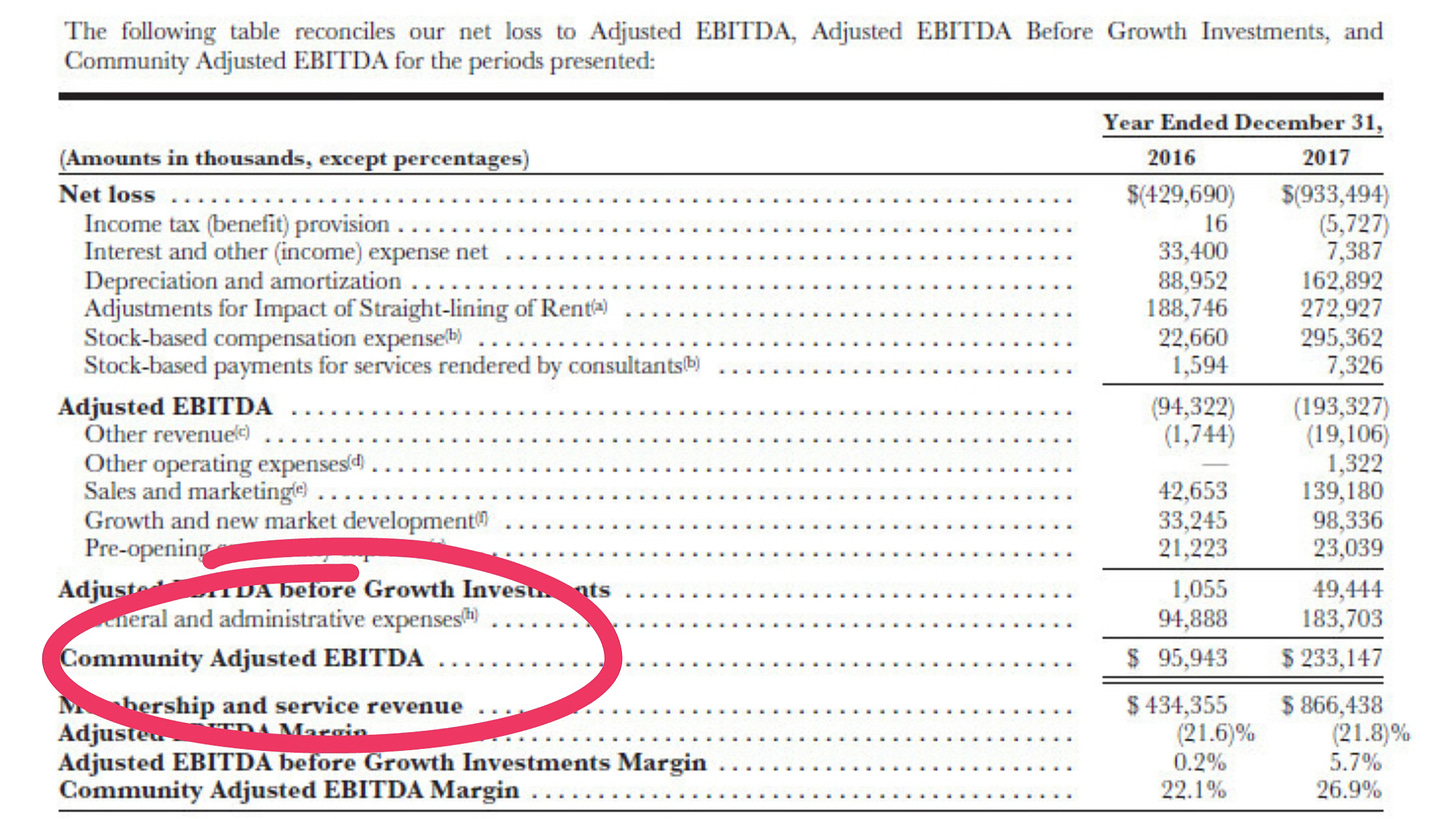
The P/E ratio can’t tell you if the company uses “non-standard” accounting policies.
Like that time when WeWork tried to IPO using “Community Adjusted EBITDA” (we still don’t know how they defined it):
The P/E ratio can’t tell you if a company is in great financial condition.
Sometimes a company can be cheap and highly profitable – a great deal on paper, until you dig deeper and see the massive debt in its balance sheet.
Like that time when we looked at an Indonesian mall operator with rising gross profits, tons of assets – and a scary wall of debt coming due.
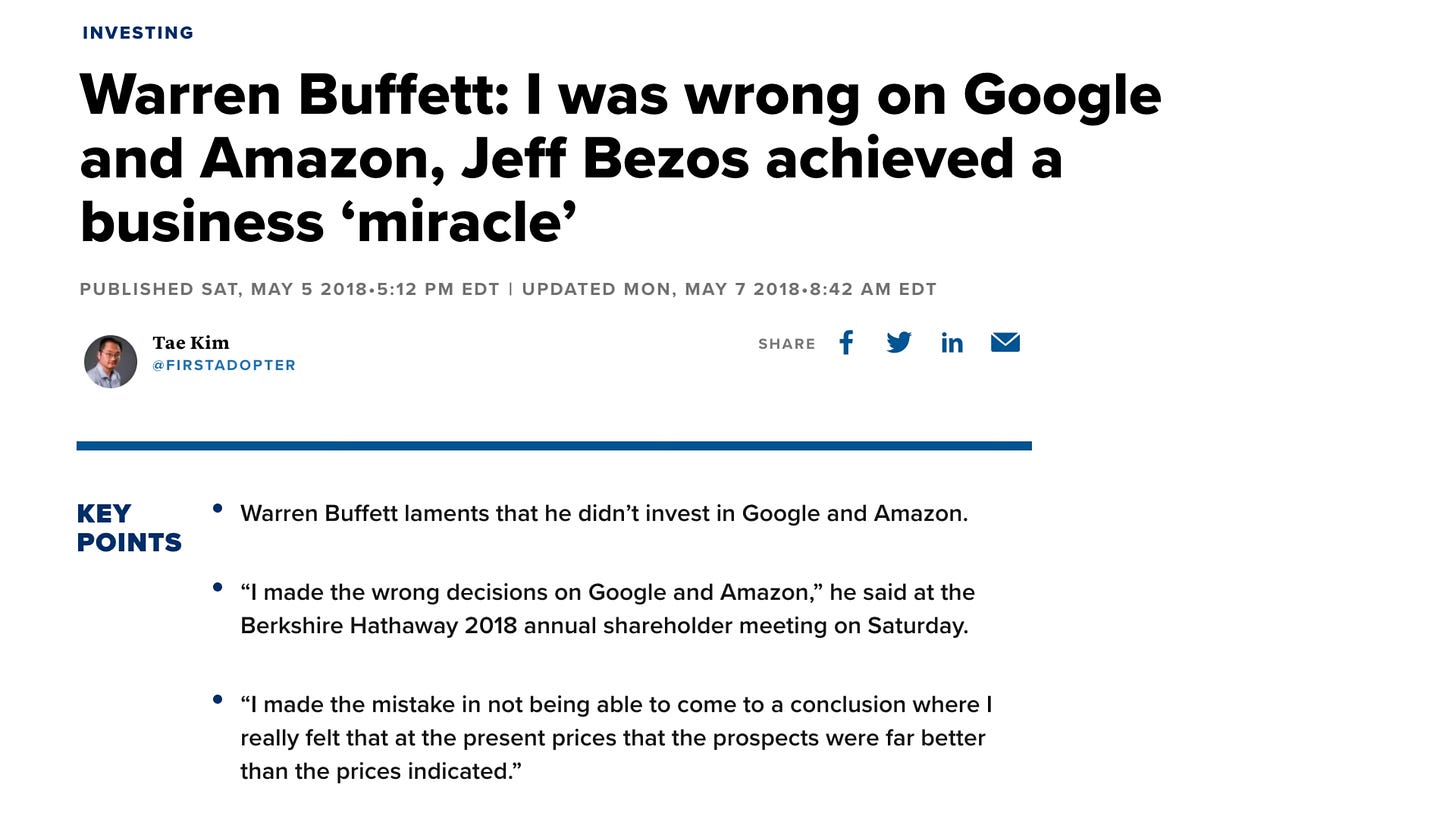
It also can’t tell you how fast a company is growing, which means you might be missing out on some amazing growth stories.
Like that time Warren Buffett had a chance to invest early in Amazon and Google and thought they were too expensive:
Not making a big mistake is really the most important thing to do when you invest. You don’t need to buy a stock every time an indicator looks good.
That’s why in our next post we’ll cover them in more detail so you’ll know what not to do.
And (spoiler alert) next week we’ll also do a deep dive into a company that’s looking really interesting based on the P/E ratio – and see if it’s a good opportunity.
“The stock market is a no-called-strike game. You don’t have to swing at everything — you can wait for your pitch.” – Warren Buffett






Great post! This is a super important topic in investing and thanks for breaking it down so beautifully.