The most common mistakes investors make when using P/E
The P/E ratio isn’t some magic figure that finds undervalued companies which somehow everyone else but you is sleeping on. This is how you can fill in the gaps.
Found a company with a really low P/E ratio?
Must be nice to hope – even for a second – that you might be the next Warren Buffett.
But the market is not stupid: there’s definitely a reason that stock is unloved.
Like Howard Marks (billionaire investor and co-founder of Oaktree Capital Management, the largest investor in distressed securities worldwide) said:
"Just because a company […] sells at a high P/E ratio doesn’t mean it’s a bad investment. Just because it’s […] low priced doesn’t mean that something’s a good investment."
So maybe first go through this checklist and make sure you’re not making one of these mistakes.
Mistake #1: comparing apples to oranges
One of the biggest mistakes people make with the P/E ratio is using it in the wrong context.
For example, in mid-March 2021 Volkswagen had a P/E of just 13.8.
That seemed really low if you compared it with the S&P 500, which had a P/E of 22.80
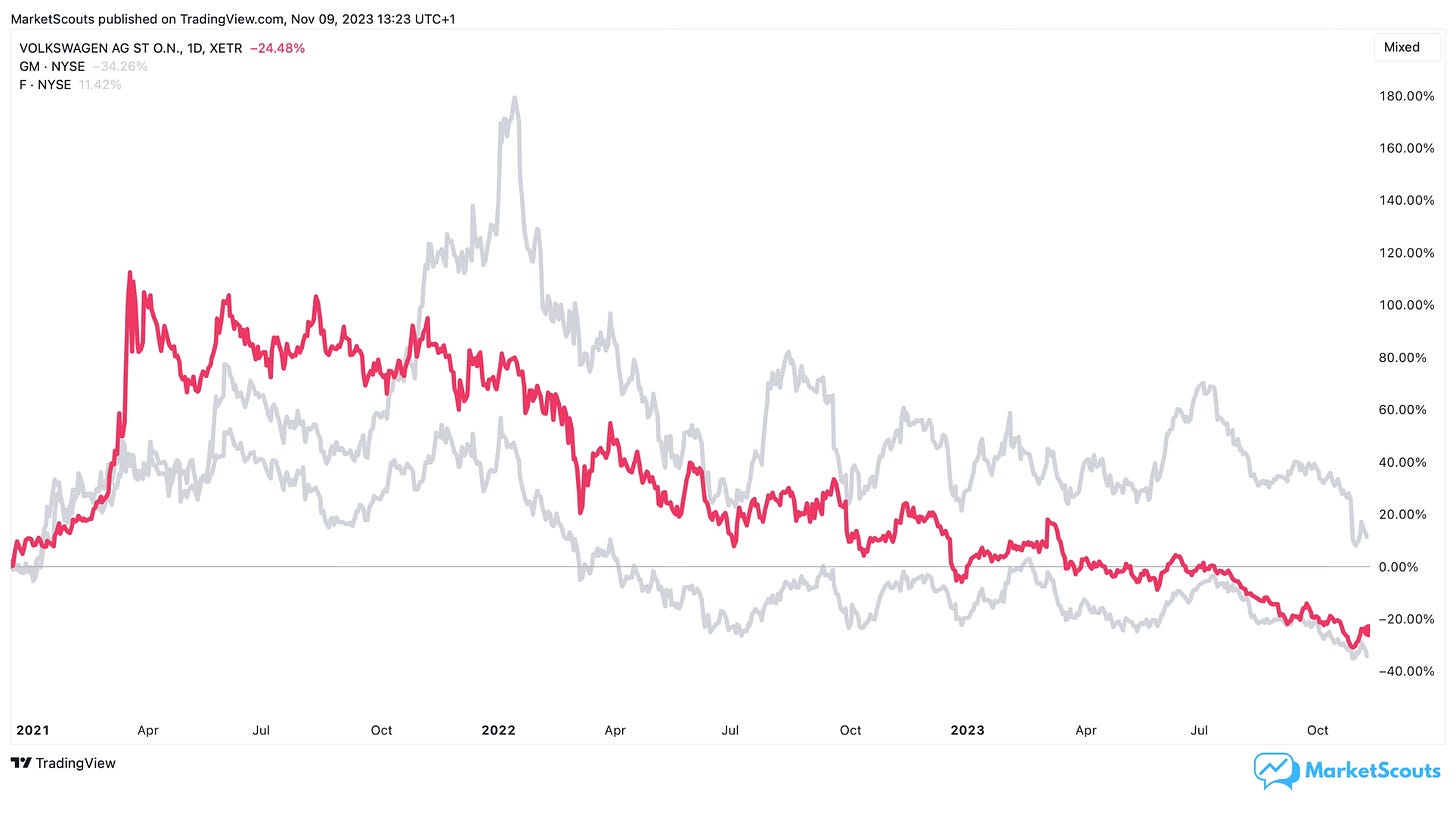
But the S&P index is made of many different companies, most with completely different business models than VW’s. In fact, VW’s P/E was actually higher than its closest competitors, such as General Motors or Ford – both of whom had lower P/Es: 9.3 and 12.1.
As a result, one could say that VW was overvalued, or at least a bit too expensive considering the environment of rising interest rates.
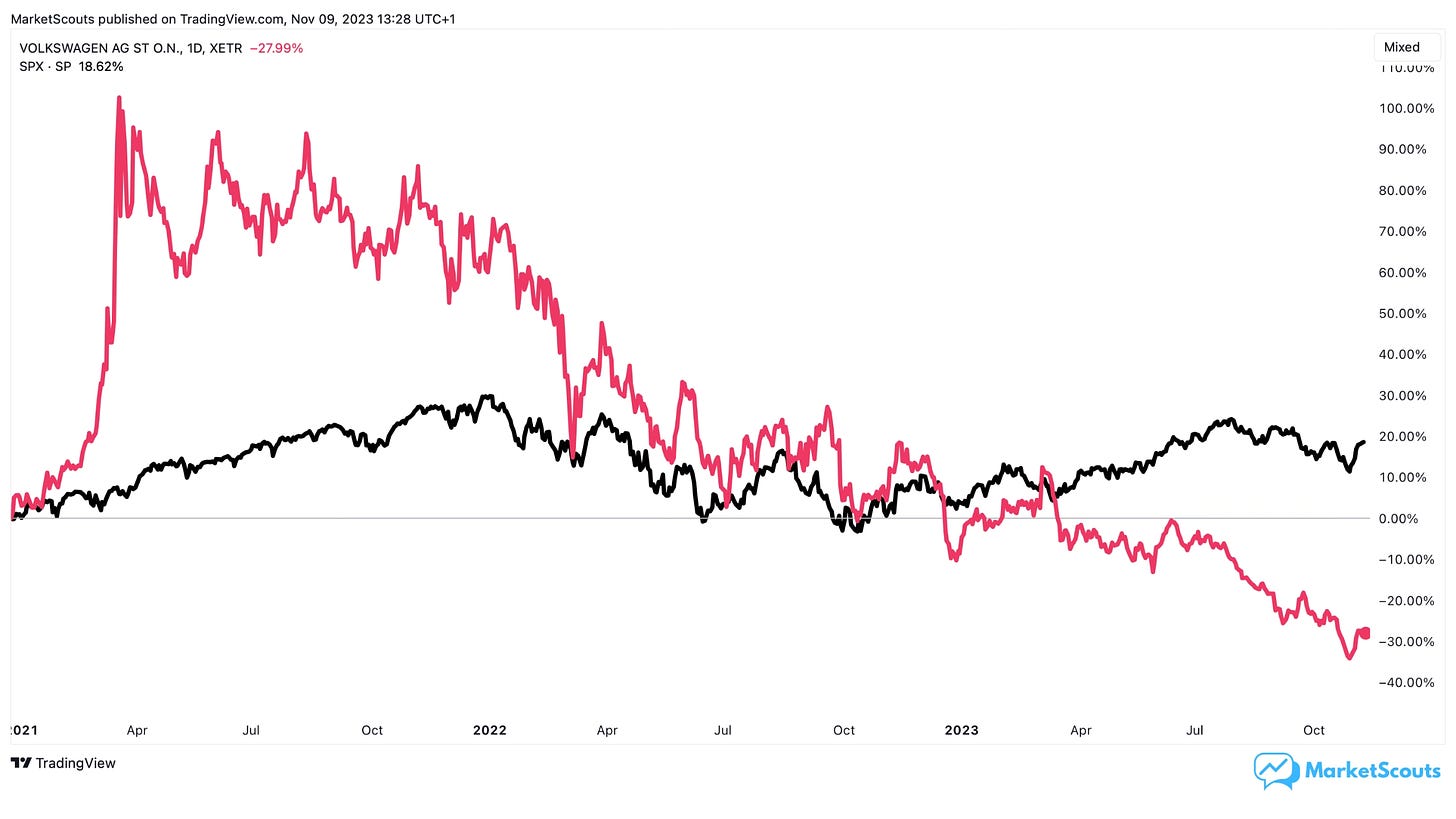
Indeed, if you were to buy VW at the time, you would have lost -62% of your investment. Its competitors also went down, but GM would have lost you only -50%, while Ford only about -19%.
And S&P 500, despite having started with a “higher” P/E than VW, actually gained about 12% since:
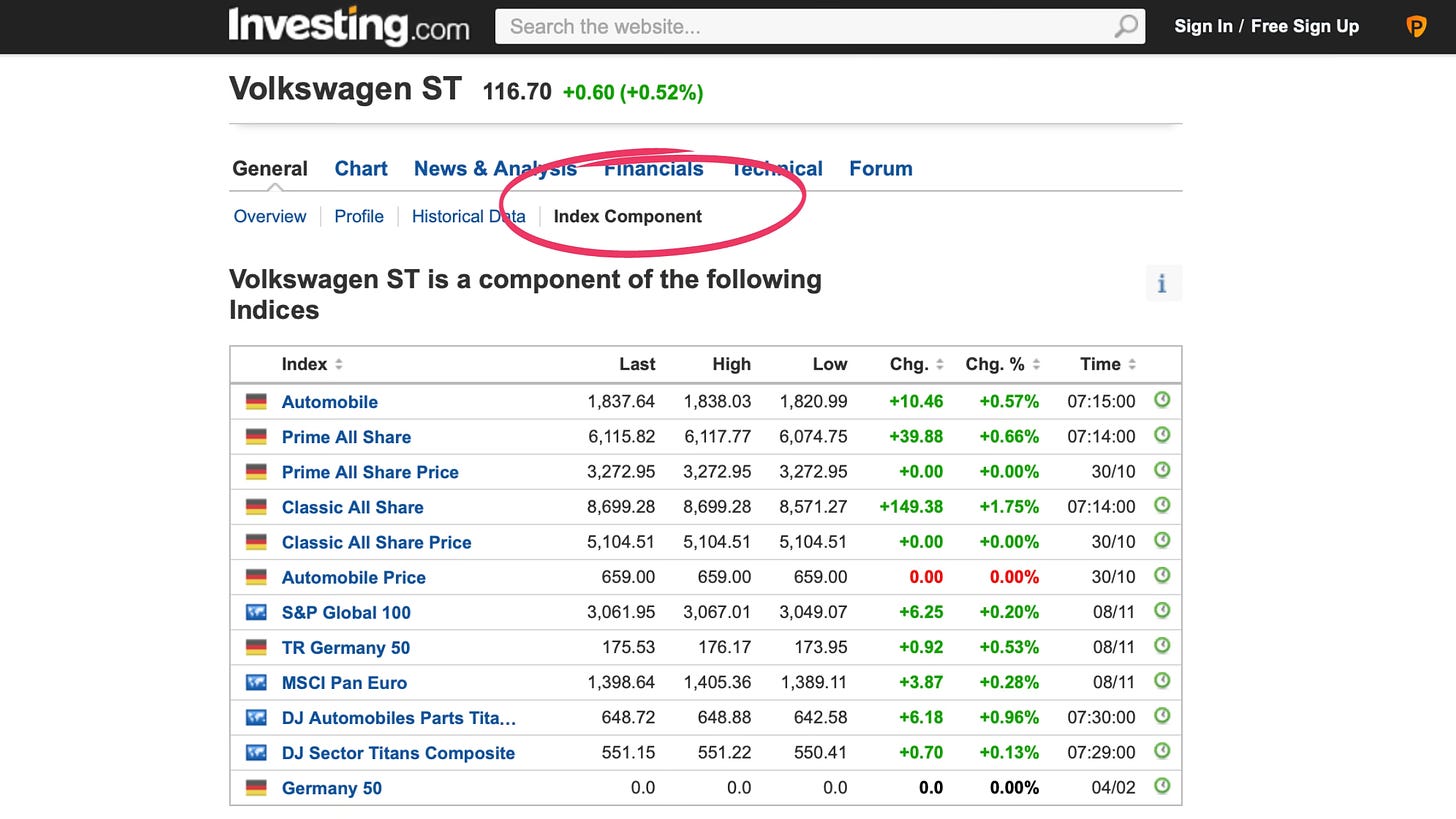
The way to avoid this mistake is simple: make sure you’re comparing the company you’re looking at with its peers (the index it’s a part of).
You can find this, for example, on Investing.com > Your stock > General > Components.
If you prefer comparing it with specific competitors, look through the index’s components.
Mistake #2: not reading the fine print
The P/E ratio is based on earnings – but earnings can be misleading.
Sometimes, earnings can be affected by “one-off” gains or losses. Other times earnings can be seasonal. Worst of all, reported earnings are often manipulated by companies’ management.
These sort of “creative accounting” policies can increase bottom line numbers and artificially decrease P/E ratios – making the stock look less expensive.
For example, in 2000, an energy company named Enron had a P/E of 10.9 – much lower not only than the S&P 500’s (20), but also than its industry average go 23.4.
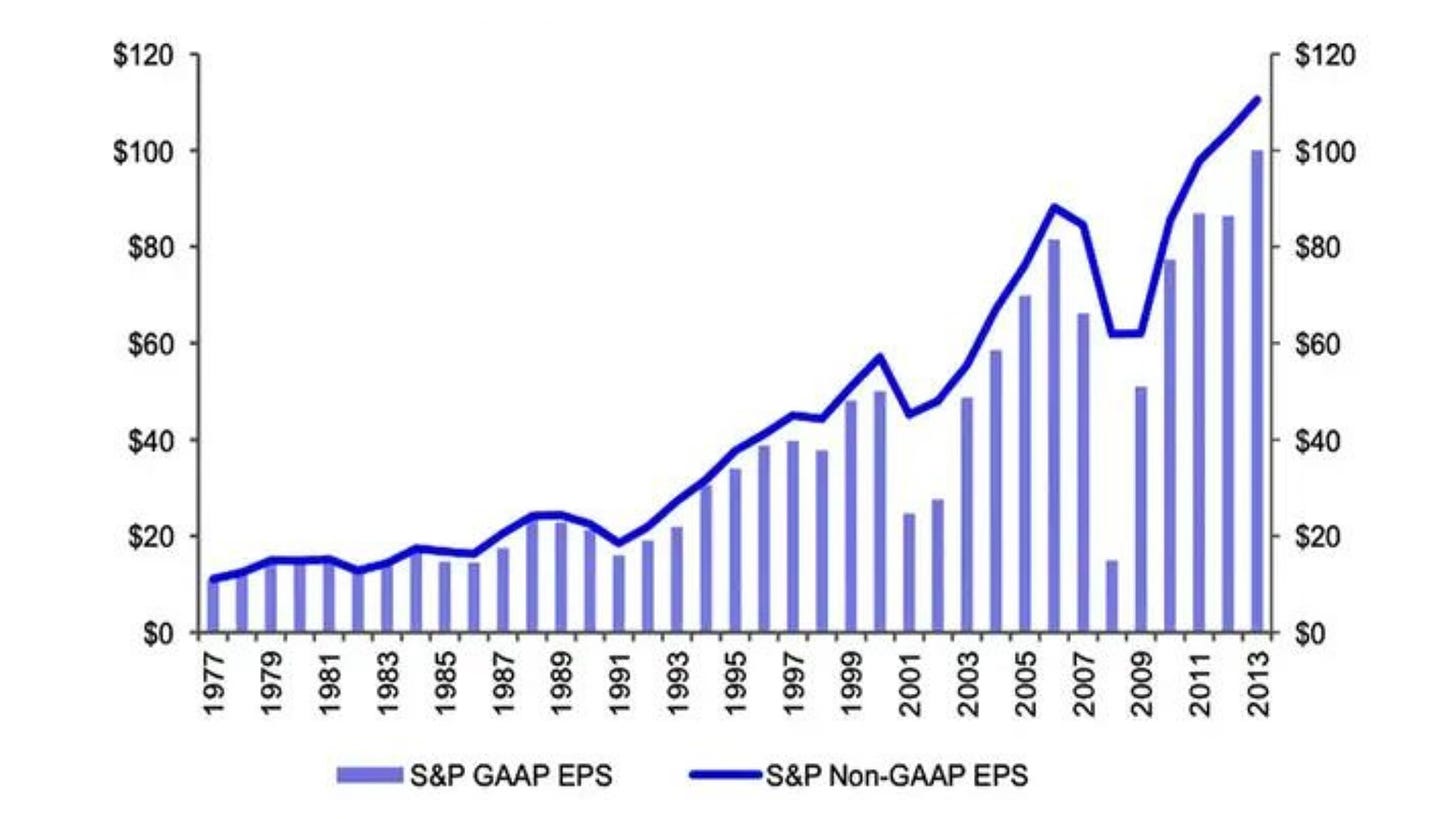
Now, here’s the catch: Enron looked so undervalued because it moved away from GAAP (“Generally Accepted Accounting Principles”) and used a variety of accounting loopholes to inflate its earnings and assets. For example, the company used special purpose entities (SPEs) to move debt and losses off its balance sheet.
Enron also used mark-to-market accounting to value its assets at their current market value, even if those assets were not readily “liquid”. They eventually got caught, their stock collapsed in 2001, and they ceased operations in 2007.
But until the very last moment things looked great:
You’d think investors have gotten smarter since.
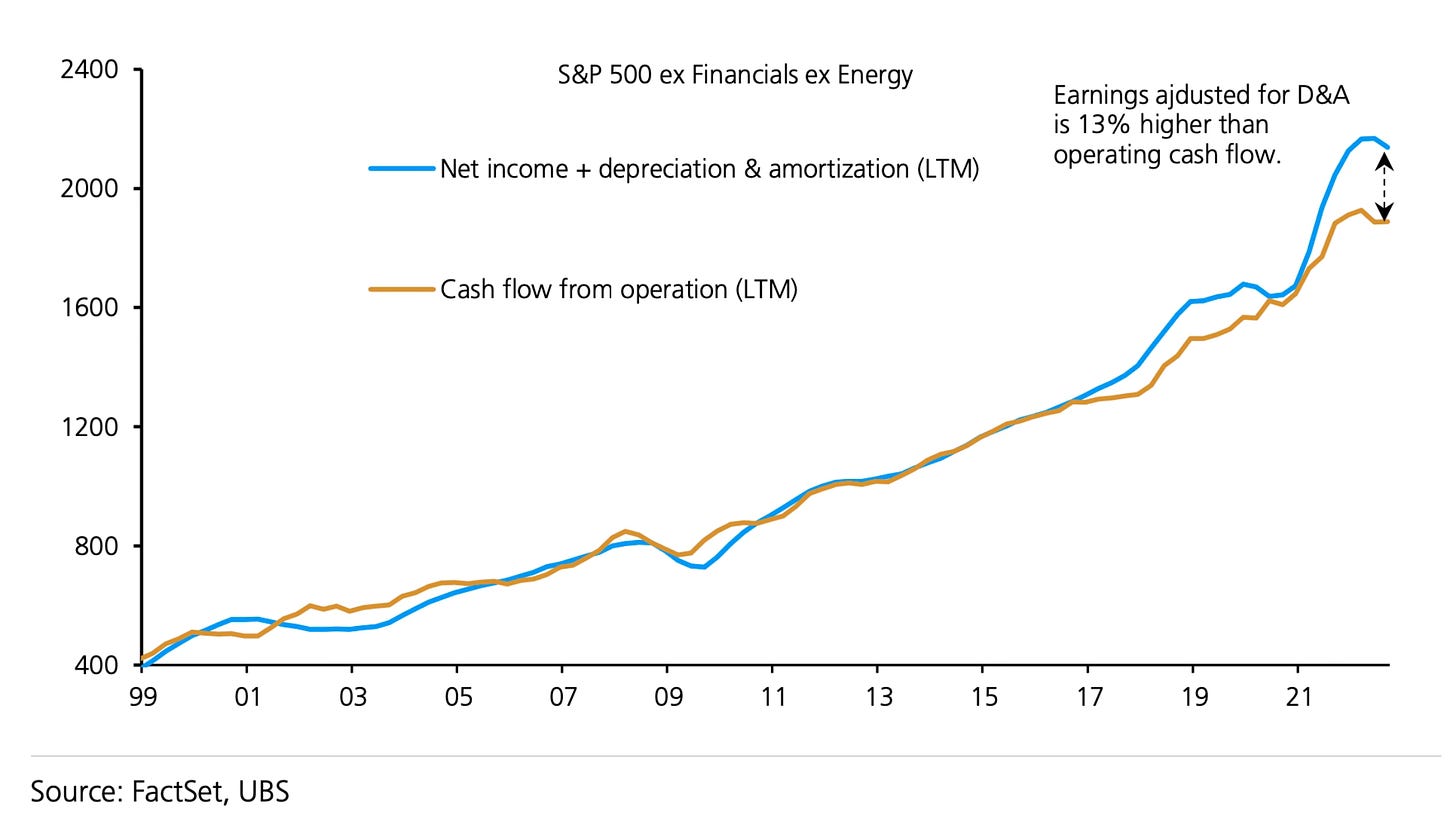
Not really: companies are still having so much fun over-estimating their earnings. And the gap is higher during times of stress in the markets.
also raised the alarm earlier this year about the gap cash flows (actual cash coming to the bank) versus what’s in the income statement.In case you’re not too familiar with accounting, you can book something as income but then wait for the money to come in. And sometimes not even that, like in the case of depreciation.
Avoiding falling for these tricks is not so easy:
One way is to use “Adjusted Earnings” when calculating P/E. This accounting method filters out one-time gains and losses.
Another is to look at the P/S ratio (the price-to-sales ratio) since it is more resistant to accounting manipulation and looks at the actual revenue (sales).
Looking at actual cash flow also helps.
Read the auditor notes, too. They’re required to express an opinion on the company’s financial statements. If you read those, you’re already in the top 1% of investors.
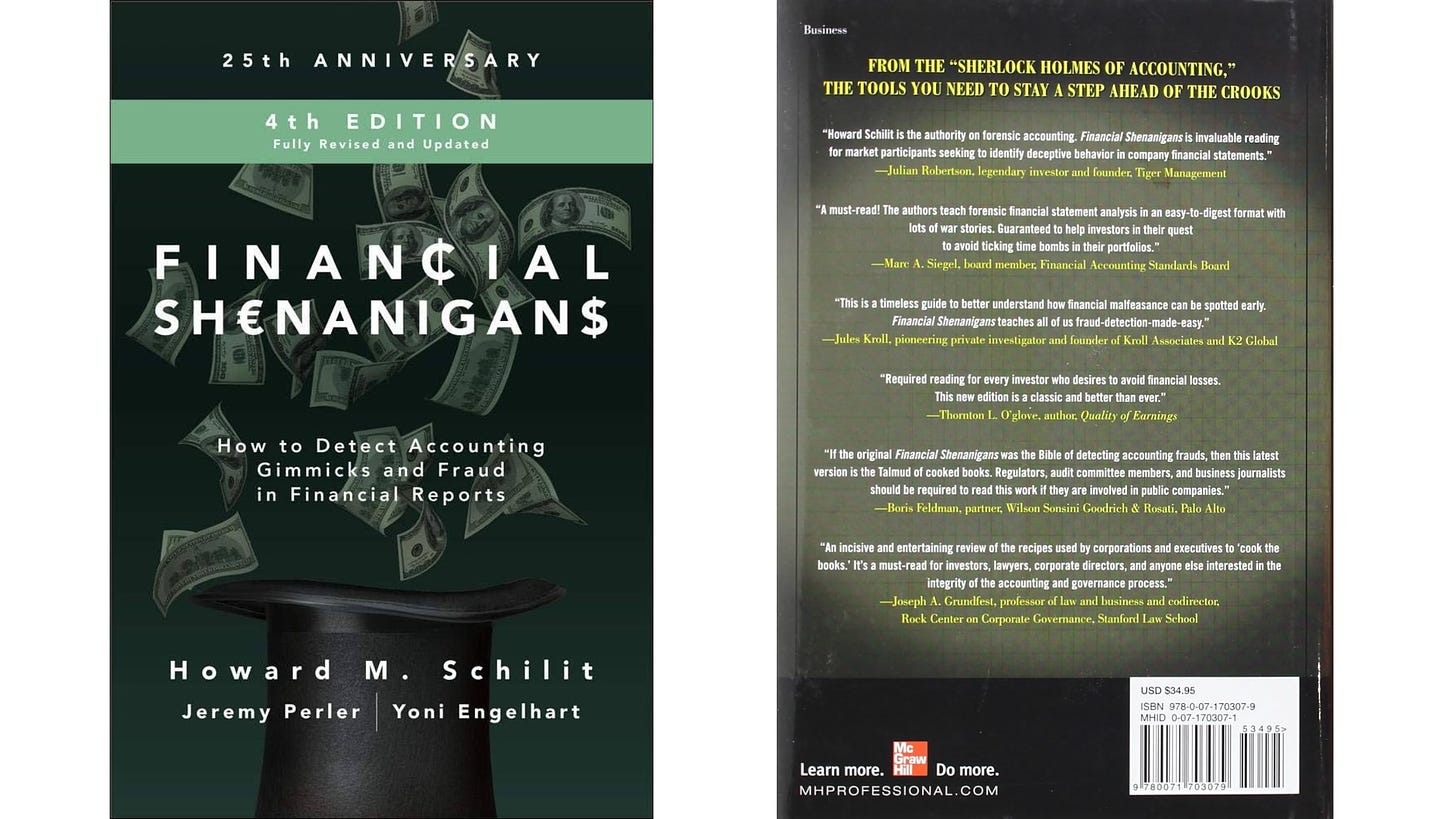
And reading a book like “Financial Shenanigans” wouldn’t hurt either.
Mistake #3: ignoring growth
It’s easy to find a company’s past earnings.
They’re important, but not as useful as you think – since they say very little about the future. And it's the company's future earnings that will actually make you money.
There are two ways to avoid making this mistake:
look at the company’s forward P/E, which uses forward earnings.
and also look at the company’s PEG ratio, which compares the P/E ratio with the company’s expected earnings growth.
Now, these aren’t perfect solutions. Forward earnings (sometimes called future earnings) are based on the opinions of analysts from various banks and investment firms.
And they generally tend to be either a bit too optimistic or too pessimistic in their guesses.
But hey, still better than nothing.
Mistake #4: ignoring debt
The P/E ratio also doesn’t say anything about how much debt the company has.
We actually looked a while back at a stock which had an attractive P/E ratio but with some digging we saw why investors were dumping it: a big wall of incoming debt.
Another example: WorldCom.
In 2002, WorldCom’s P/E was 7.5. However, that didn’t tell us much about its financial condition. The company was highly leveraged, with a debt-to-equity ratio of over 4:1. This meant that WorldCom was very sensitive to changes in interest rates and the economy. In 2002, the company collapsed, revealing its earnings were inflated by $11 billion.
So obviously debt levels have a big impact on how investors value companies – yet the P/E ratio doesn’t help you there.
You can’t look at two companies, even close competitors, just on the basis of the P/E ratio, because you don’t understand how financially healthy each company is.
There are a few ways to avoid this mistake:
One way is to replace price with the company’s enterprise value (EV), which looks at debt too. And then replace earnings with EBITDA (which tells us a bit more about its profit before paying interest on debt). In this case P/E becomes EV/EBITDA.
You should also look at a company’s debt-to-equity ratio and debt-to-assets ratio, as well as the interest coverage ratio (EBIT versus interest payments).
Mistake #5: ignoring quality
There are many ways to make a profit, not all of them super efficient. Some companies make better use of their assets and inventory, simple as that.
You will also want to look at a company’s:
operating margin and EBITDA margin
inventory turnover (compares inventory to its cost of sales, or COGS)
return on assets (ROA)
asset turnover ratio (or how much revenue they get from their assets)
and return on equity (ROE).
These ratios can help you identify well-managed, profitable companies that use their equity and assets to generate actual revenue, profits, and growth.
Now what?
So when is the P/E ratio actually useful?
The answer: when earnings are stable and reasonably predictable.
And even then, be wary of P/Es that are extremely low when put up against the industry and competitors.
A rule of thumb is the higher the quality of business, and the more predictable its future, the higher P/E the market is willing to accept.
On the other hand, don’t discount moderately high P/Es either. The P/Es reflect the market’s expected growth rate based on a company’s earnings – a higher P/E means higher expected growth.
That’s why it’s important to look at other indicators, like EV/EBITDA, P/S, and all the other ones we talked about here.
And remember that the P/E ratio isn’t some magic figure that finds undervalued companies which somehow everyone else (but you) is sleeping on, but a useful tool that can quickly give you a sense of an opportunity.
It’s up to you to unlock it.





Great overview of the common mistakes we make when using P/E ratio!
I will be honest, i have myself made some of these mistakes, and it is not my favorite indicator.
I prefer looking for companies growing top and bottom line, with attractive margins, generating strong cash flows, and financially solid. I then time my entry using technical indicator for attractive risk-reward. Regardless of what the P/E ratio might be!